
When many people turn on the TV or look at their phones to see how the stock market is doing, many look at the S&P 500.
The question is, does that make any sense?
What is the S&P 500? The Standard & Poor’s 500 Index is a stock market index that measures the stock performance of 500 large companies listed on stock exchanges in the United States. It is one of the most commonly followed equity indices, and many consider it to be one of the best representations of the U.S. stock market.
What is a benchmark? A benchmark is a standard against which the performance of other investments is measured against.
Using the S&P as a benchmark— say the S&P was up 10% last year. Then say your brokerage account with your local financial planner was up 6%. If you used the S&P as the benchmark to measure (compare), you’d be comparing 10% to 6%.
Most people would say that the 6% investment significantly underperformed.
But is that fair? Many times it is NOT!
Risk vs. Reward — It’s not fair to compare only the investment returns of two assets. Why? Because in order to do a fair apples-to-apples comparison you must look at the risk taken to achieve the return.
For example — the following numbers compare the S&P vs. a typical mix of 60% stocks to 40% bonds from January 2007 to December 2019. The numbers come from the OnPointe Investment Risk software program. CAGR (Compound Annual Growth Rate) is the rate of growth on money as it really grew over the time frame.
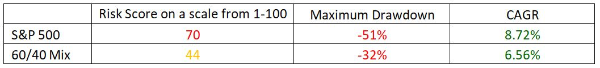 The S&P had a 33% higher rate of return. If we used the S&P as a benchmark, we’d have to come to the conclusion that the other investment was not very good and should be exchanged for a different mix of investments that would generate higher returns.
But does that make sense? No, it really doesn’t.
Why? Look at the maximum drawdown (recent high to recent low) for both investments. The S&P was down 51% and the 60/40 mix of stocks to bonds was down 32%. If you invested in the S&P 500, you had to take much more risk to achieve a higher return.
The 60/40 mix is not designed to generate the same types of returns as the S&P and the returns it does generate come with a much lower risk of loss.
Prudent investing
For many people (except for maybe the mega affluent), it may not be prudent to have a sizable amount of money in the S&P 500. The risk of loss in the S&P (the market as a whole) is too high.
If that’s the case and if most people who work with a financial planner are in suitable investments (ones that are not too risky), does it make sense to turn on the TV, look at the S&P, and then compare it to your investments? Nope!
If you are in a prudent mix of investments that provide decent upside growth over time but also are designed to protect your money in large downturns, it will make NO sense to use the S&P 500 as a benchmark.
What’s the point of this newsletter?
Don’t get hung up on the returns of the S&P 500 in an upmarket. If you are in a prudent mix of investments, they shouldn’t be keeping up with the S&P 500. This means that you shouldn’t get upset that your investment account only grows at 50%-70% of what the S&P returns.
It also means that when the next stock market crash comes, if you are in a prudent mix of investments, you will most likely lose money, but it shouldn’t be anywhere near the negative returns of the S&P 500.
If you want information on wealth-building tools that limit or even prevent negative returns in the stock market and can provide for you reasonable returns over time, please give me a call or drop me an email and I’d be happy to provide you with information n these tools.
The Standard & Poor’s 500 (S&P 500) is a market-cap weighted index composed of the common stocks of 500 leading companies in leading industries of the U.S. economy.